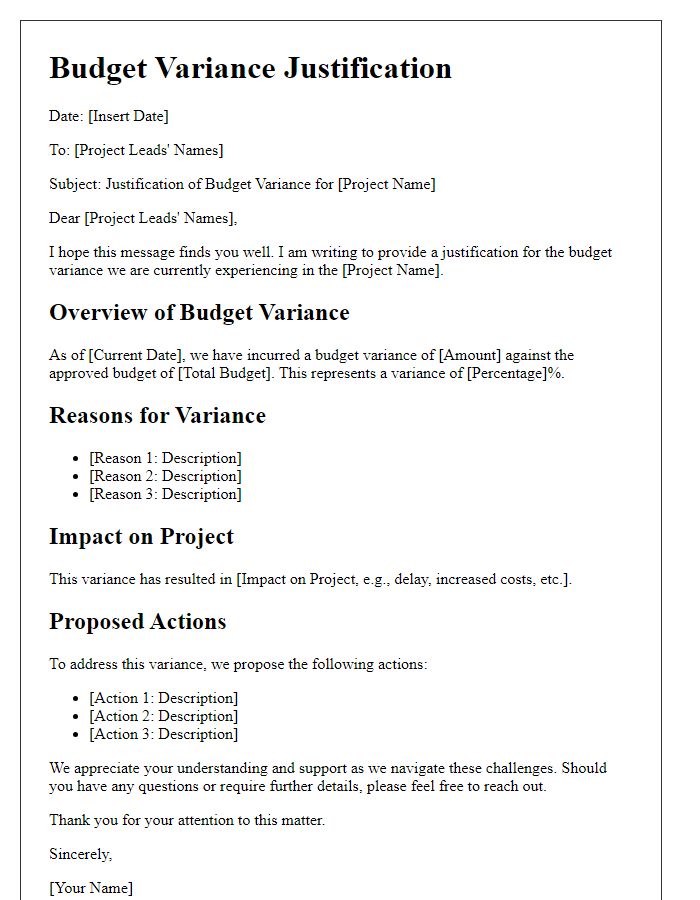
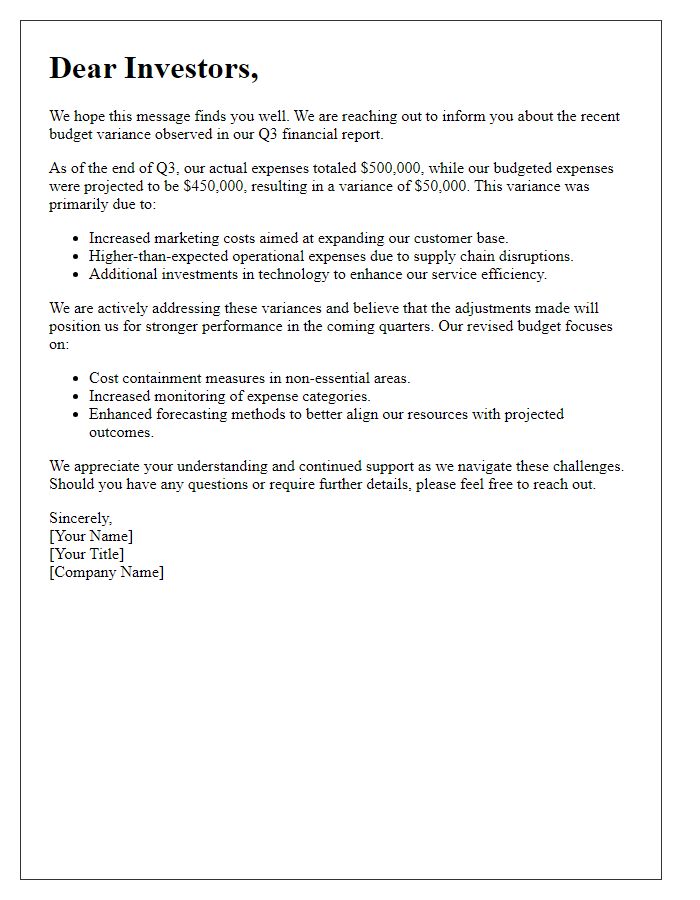
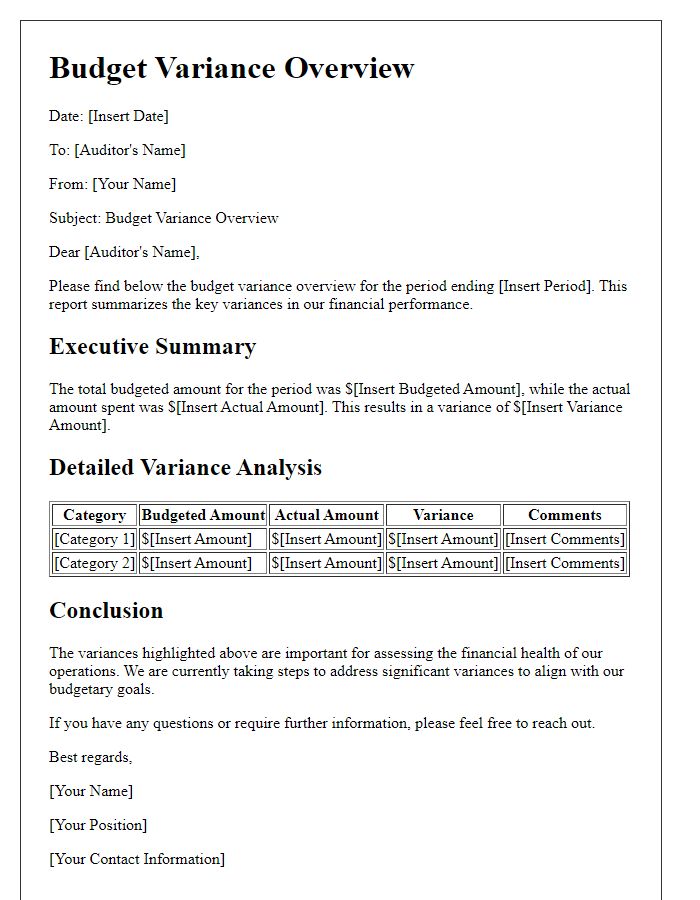
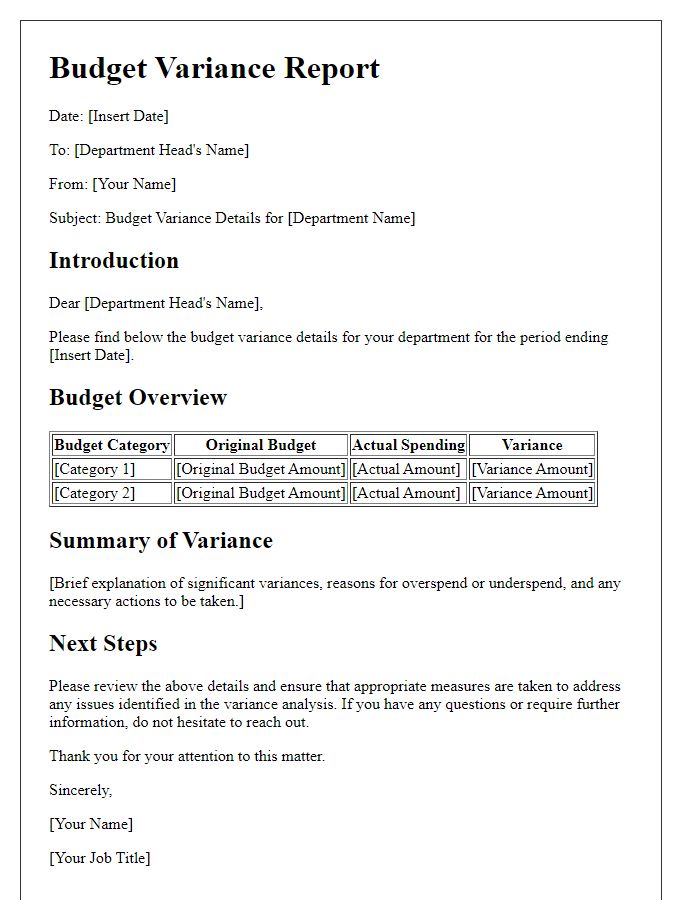
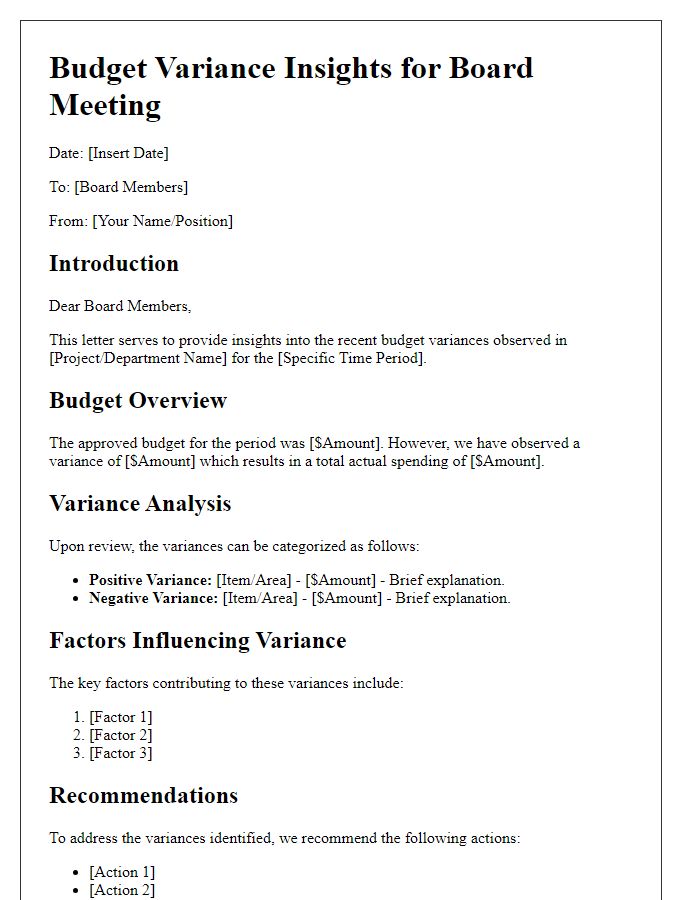
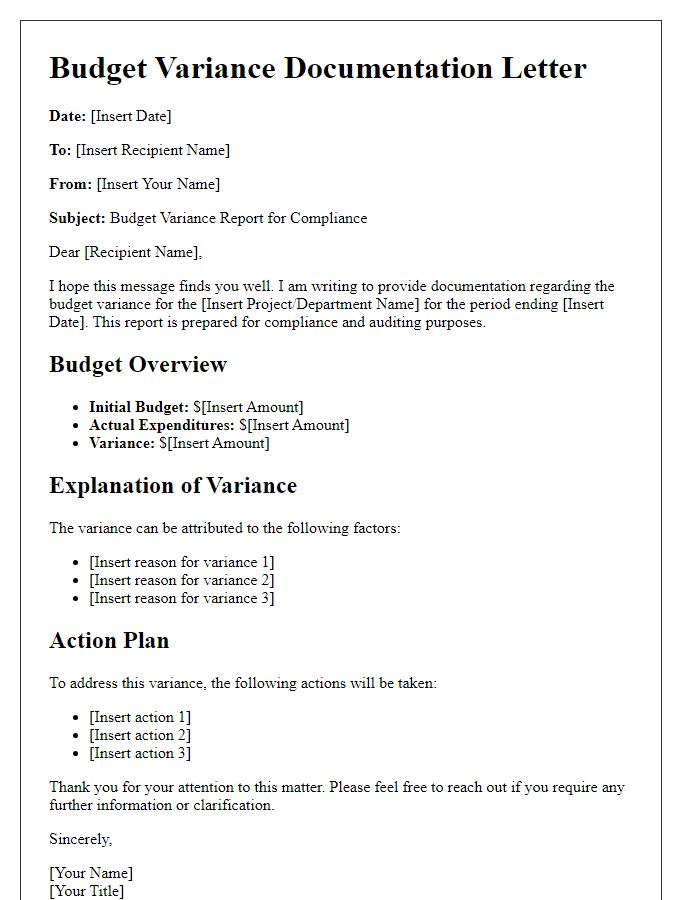
Are you struggling to explain budget variances to your team or stakeholders? A well-crafted letter can help clarify discrepancies and foster understanding. In this article, we'll provide you with a detailed template to effectively communicate budget variances while maintaining transparency and professionalism. So, let's dive in and explore how to construct a clear and concise explanation that resonates with your audience!

Clear identification of variance sources
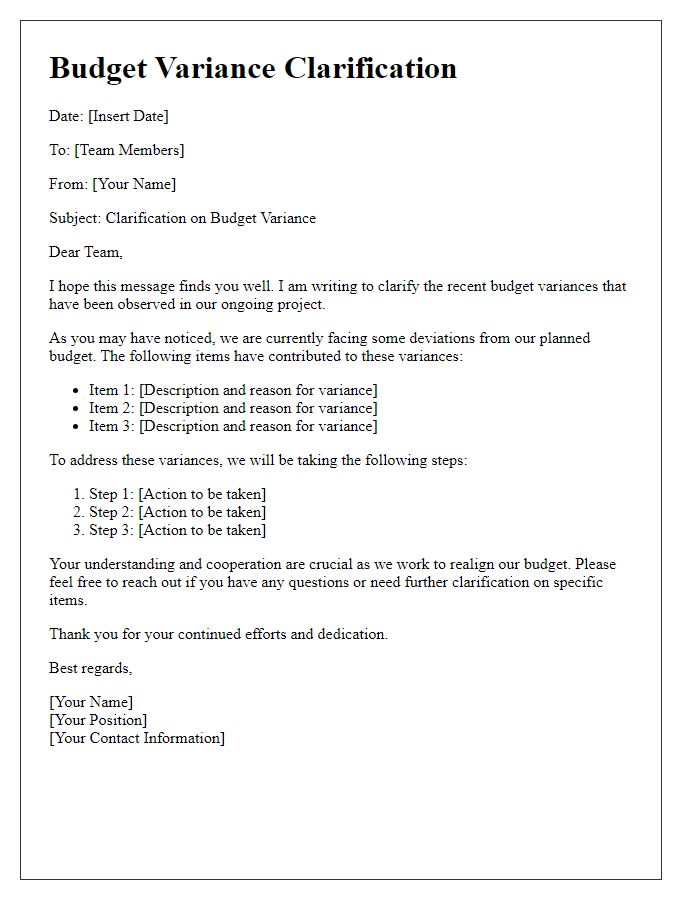
Budget variances often arise from unexpected costs or savings in various departments within an organization. For instance, in a manufacturing company, raw material expenses (like steel or plastics) can fluctuate due to market demand shifts, impacting overall budget allocations. Conversely, labor costs may decrease if a project experiences delays, leading to savings in payroll expenditure. Additionally, utility bills (electricity, water) may exceed projections due to seasonal changes, such as extreme weather causing increased heating or cooling needs. Regular tracking of these variances through financial statements allows for a clearer identification of sources and helps in future budget planning.
Detailed financial analysis
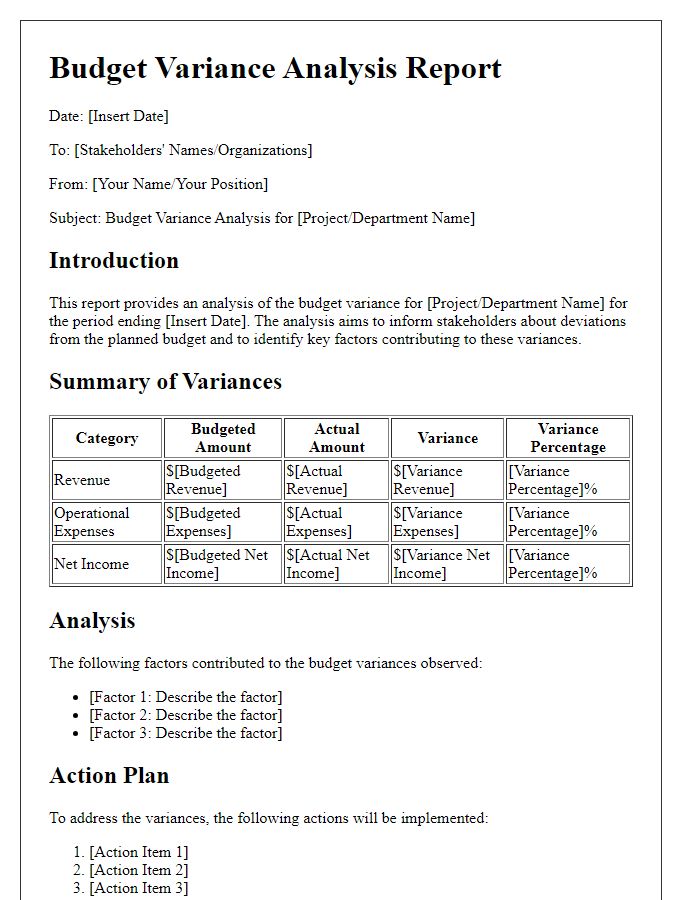
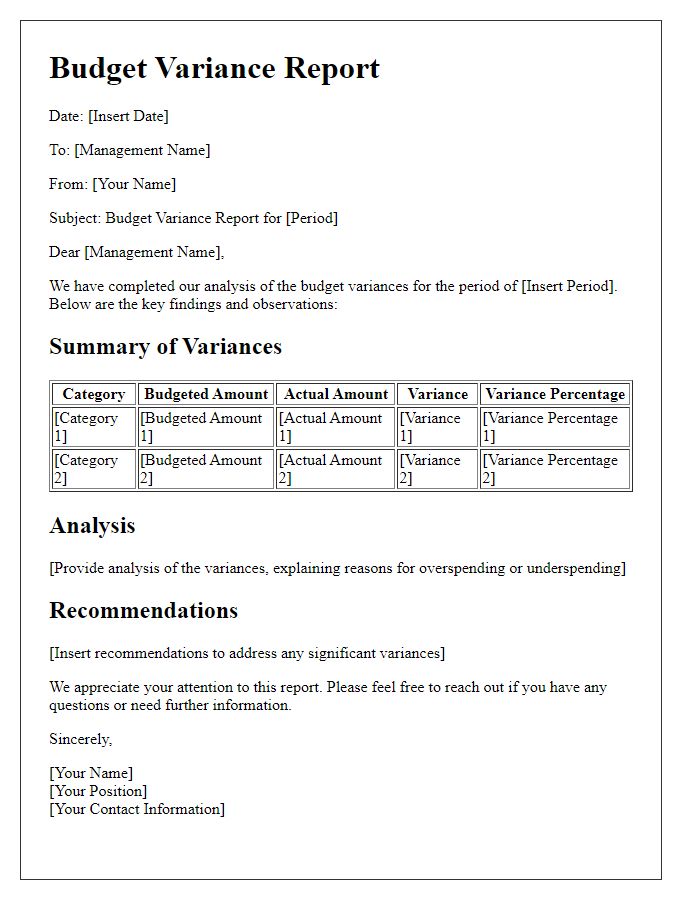
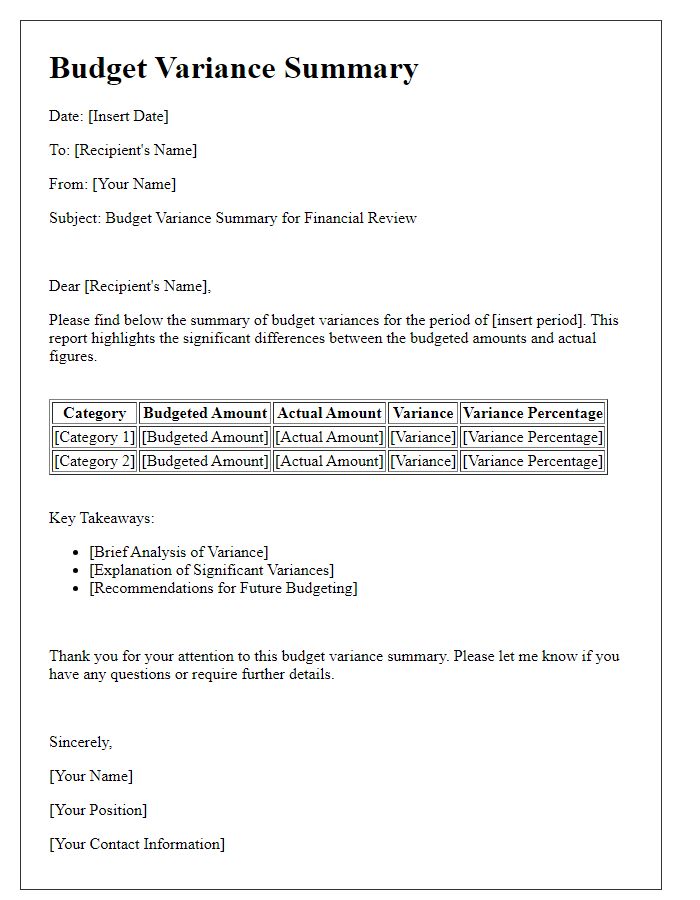
A comprehensive budget variance analysis provides critical insights for organizations to assess financial performance against planned budgets, typically delineating differences in revenue and expenditure. Notable discrepancies, often expressed in monetary terms, can highlight areas of fiscal inefficiency or unexpected income. For instance, a 15% negative variance in operational expenses might pinpoint overspending in departments such as marketing or human resources within a specific quarter, like Q3 2023, where actual expenses soared to $150,000 compared to the projected $130,000. Conversely, a positive variance in sales revenue, perhaps 20% higher than budgeted, could reflect unforeseen demand for a product line, influencing strategic decisions moving forward. Identifying these variances meticulously supports initiatives for budget reallocation and improved financial forecasting in subsequent fiscal periods.
Plan for corrective actions
Budget variance analysis highlights discrepancies between forecasted financial figures and actual performance, often revealing crucial insights into organizational efficiency. Common variances can occur in cost categories such as labor expenses (which may exceed projections by 15% due to unexpected overtime), supplies (increased by 20% because of market inflation), or capital expenditures (where purchasing delays added 10% in additional costs). Identifying the root causes of these variances allows for strategic remedial actions. Implementing cost control measures, such as renegotiating supplier contracts or adjusting staffing schedules, can mitigate financial impacts. Regular financial reviews (monthly assessments) should be scheduled to ensure alignment with projected budgets and facilitate proactive adjustments.
Alignment with strategic goals
Budget variance analysis plays a crucial role in aligning financial performance with strategic goals of an organization. Variances, which represent the differences between budgeted and actual figures, can reveal insights into operational efficiency and resource allocation. Understanding significant variances, like operational costs exceeding projections by 15% or revenue shortfalls of 10% compared to estimated figures, allows management to refine strategies effectively. For instance, if specific product lines, such as electronics or apparel, are consistently underperforming, leadership can reassess marketing approaches or product offerings to strengthen alignment with overall business objectives. Furthermore, quarterly reviews of these variances, coupled with a strategic framework like the Balanced Scorecard, help ensure that financial goals reflect the broader mission of profitability, market expansion, or customer satisfaction. The ongoing monitoring fosters accountability across departments, promoting a cohesive approach to achieving organizational success.
Use of data visualization tools
Utilizing data visualization tools, such as Tableau and Power BI, can significantly enhance the clarity and comprehension of budget variance reports. These platforms facilitate the presentation of complex financial data, allowing stakeholders to quickly identify discrepancies in budget allocations (e.g., expenses exceeding the budget by 15% in Q2 2023). Visual elements such as charts and graphs can effectively showcase trends over time, highlighting areas of overspending or underspending (e.g., project costs surging by 25% in marketing campaigns). The ability to filter data by departments or projects creates a more focused analysis, improving decision-making processes for financial strategies and resource allocation efforts. This comprehensive visual representation not only aids in spotting issues swiftly but also fosters transparency and accountability among team members involved in financial planning and management.



Comments