Are you looking to enhance your organization's operational efficiency but unsure where to start? In today's fast-paced business landscape, understanding the intricacies of your processes is crucial for staying ahead. A well-structured operational efficiency report can be a game changer, offering insights and strategies tailored to your specific needs. Dive in with us to explore how to create an impactful report that drives results and transforms your operations!

Executive Summary
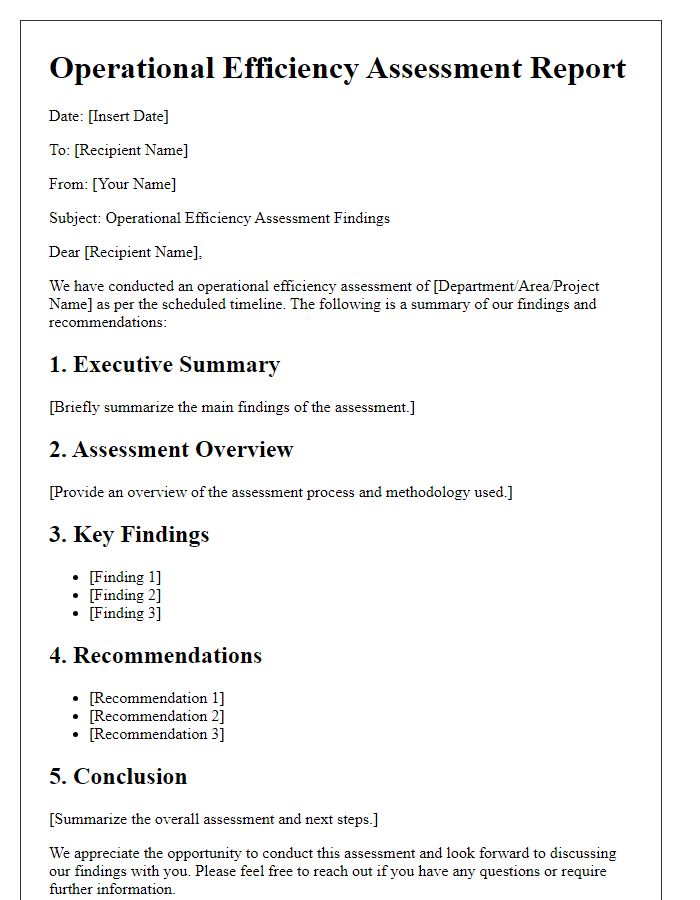
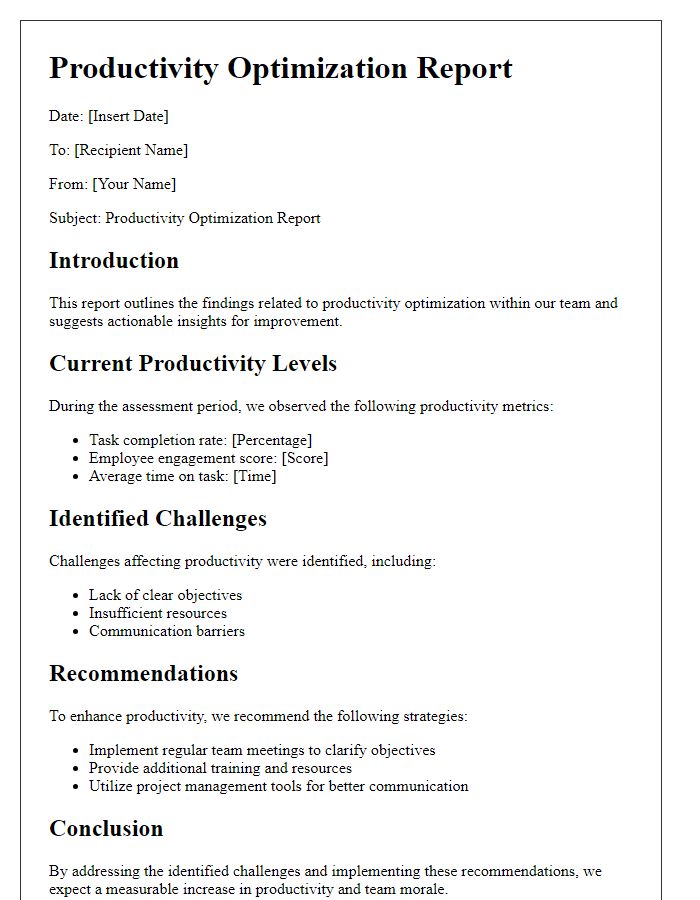
Operational efficiency reports provide a comprehensive overview of a company's performance metrics, analyzing processes, procedures, and resource utilization. Key performance indicators (KPIs) outline productivity levels, identifying areas for improvement within various departments. Tools and methodologies like Lean Six Sigma, commonly used in manufacturing settings, allow for the systematic elimination of waste, aligning with the goal of maximizing output while minimizing costs. Data analytics software plays a critical role in measuring operational health, utilizing real-time metrics to track efficiency across different operational phases. Regular assessments ensure tasks are streamlined, ultimately enhancing overall profitability and competitiveness in the market.
Key Performance Indicators (KPIs)
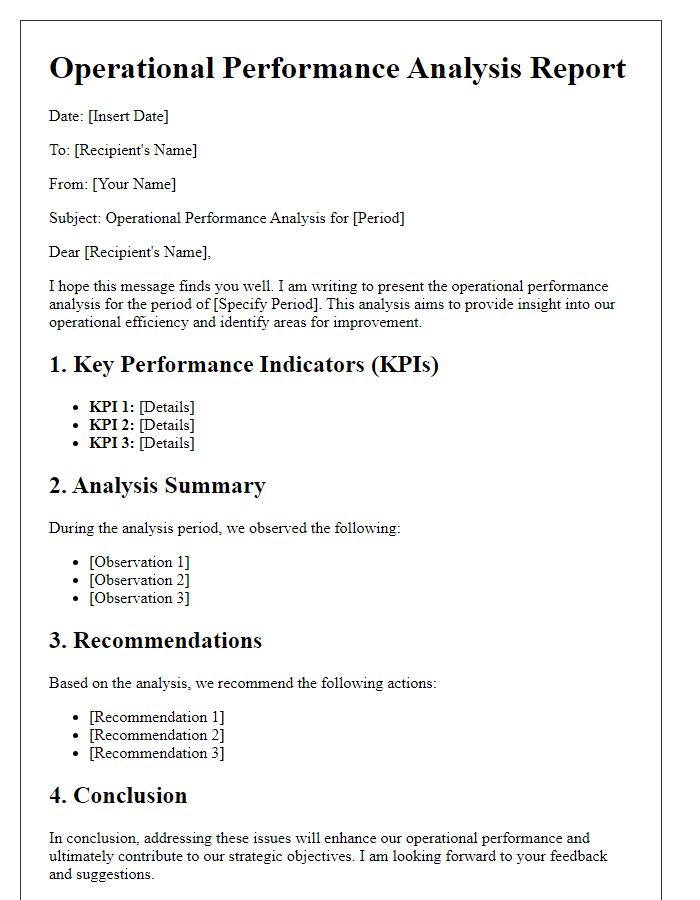
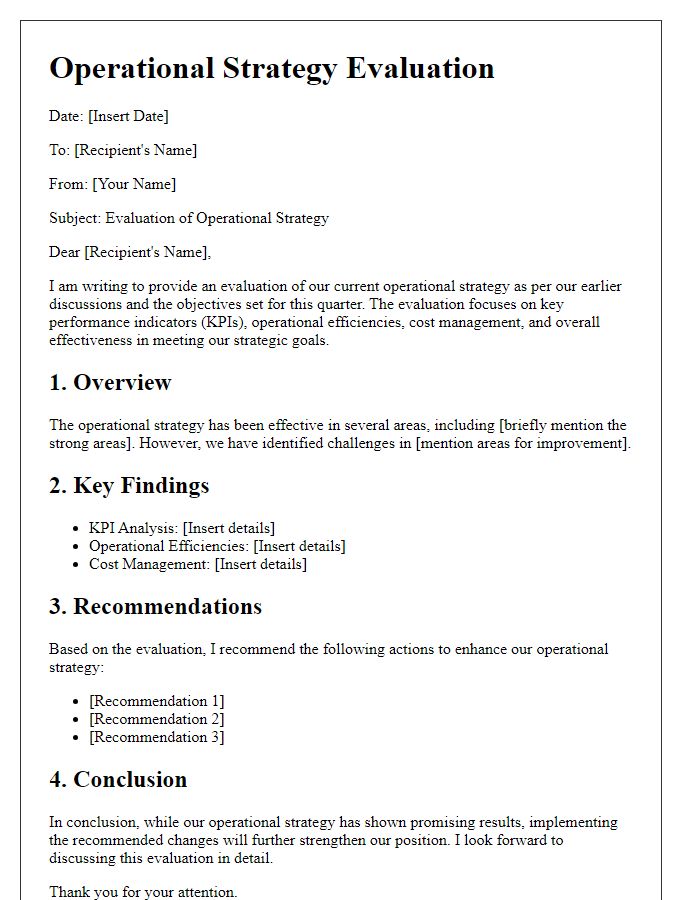
An operational efficiency report highlights Key Performance Indicators (KPIs) critical for assessing organizational performance. KPIs such as Overall Equipment Effectiveness (OEE), a metric indicating the percentage of manufacturing time that is truly productive, and Cycle Time (the total time from the beginning to the end of a process) serve as benchmarks. Additionally, Cost per Acquisition (CPA) measures the total cost to acquire a customer, providing insight into marketing effectiveness. Meanwhile, Employee Productivity metrics, often measured in output per hour, reflect workforce efficiency. These indicators guide management in strategic planning, resource allocation, and continual improvement initiatives. Analyzing KPIs allows organizations to pinpoint weaknesses, streamline operations, and enhance overall performance.
Data Analysis and Insights
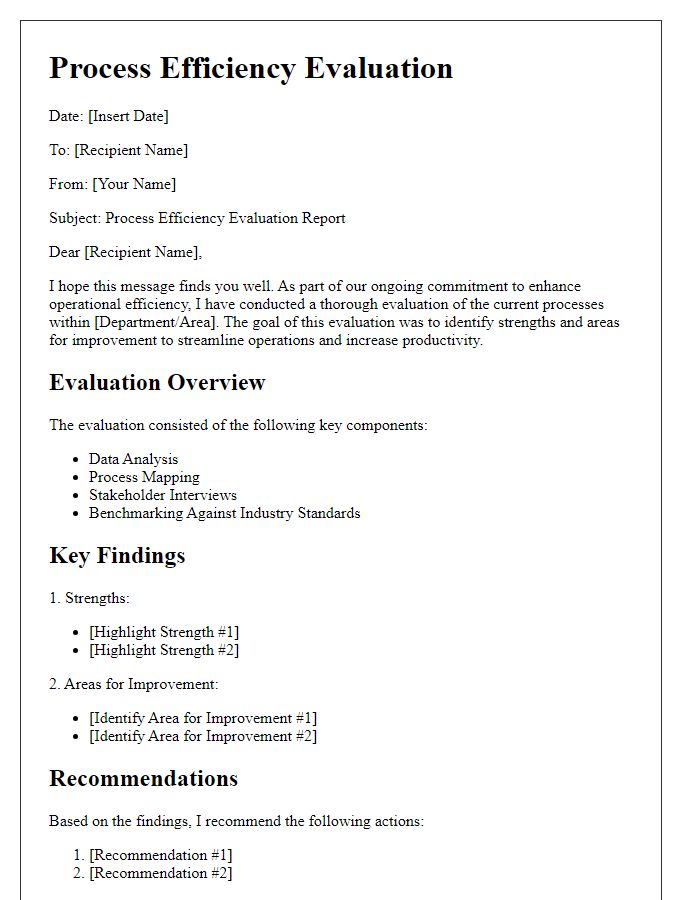
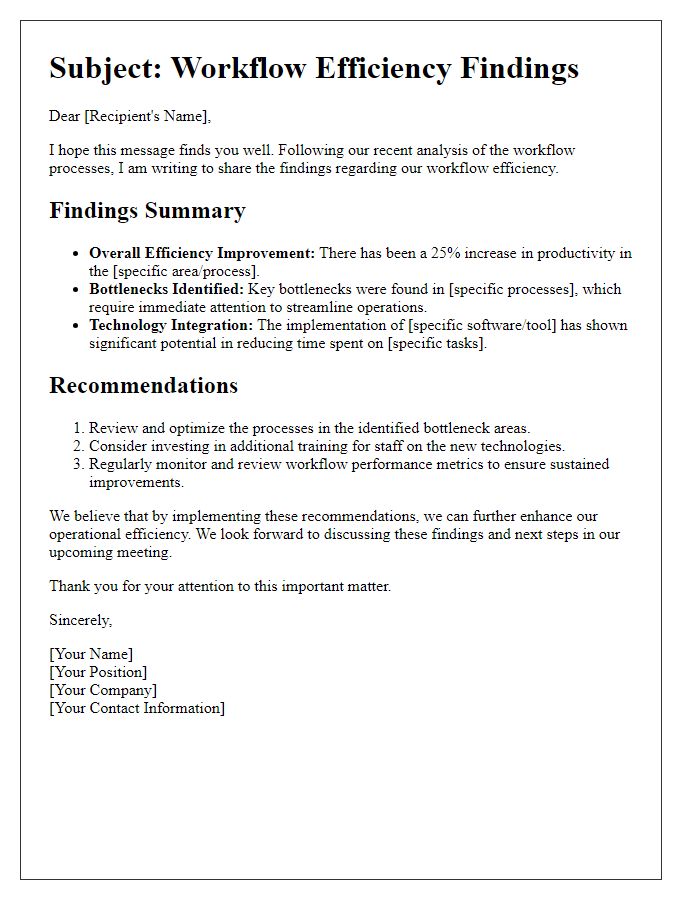
Operational efficiency reports focus on analyzing data trends to enhance productivity and performance metrics. Key performance indicators (KPIs) such as cycle time (the total time to complete a process) and throughput (the number of units processed over a specific period) provide essential insights into operational workflows. Data visualization tools like dashboards allow stakeholders to access real-time information for informed decision-making. Understanding process bottlenecks, identified through root cause analysis, can lead to targeted improvements and strategies. In industries such as manufacturing, inventory turnover rates can significantly impact efficiency, emphasizing the necessity for effective supply chain management. Additionally, employee engagement metrics often correlate with operational success, indicating the importance of workforce involvement in driving performance enhancements. Analyzing these intricate variables ensures a robust framework for continuous improvement.
Recommendations and Action Plan
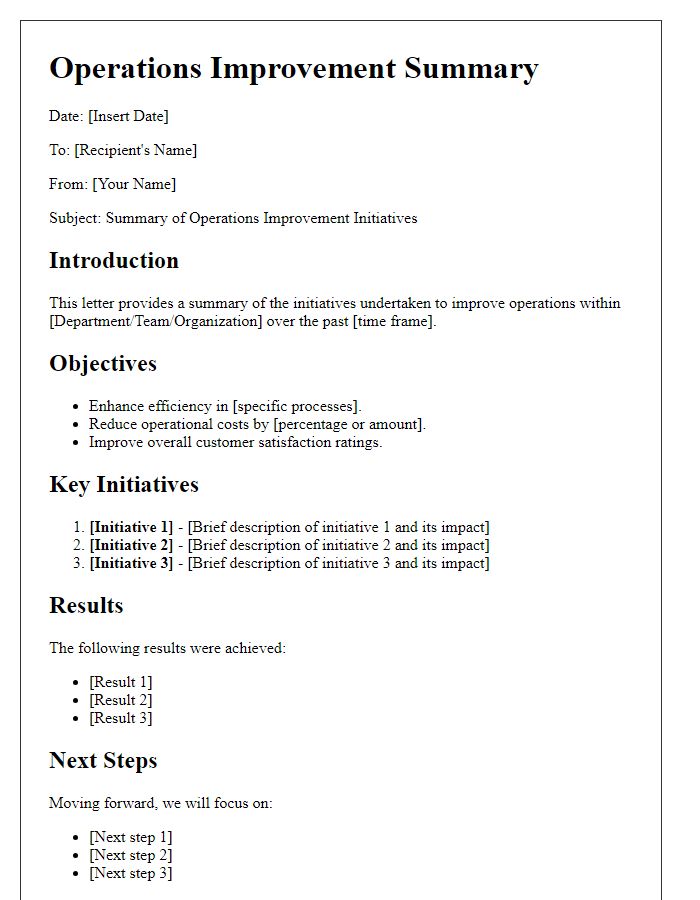
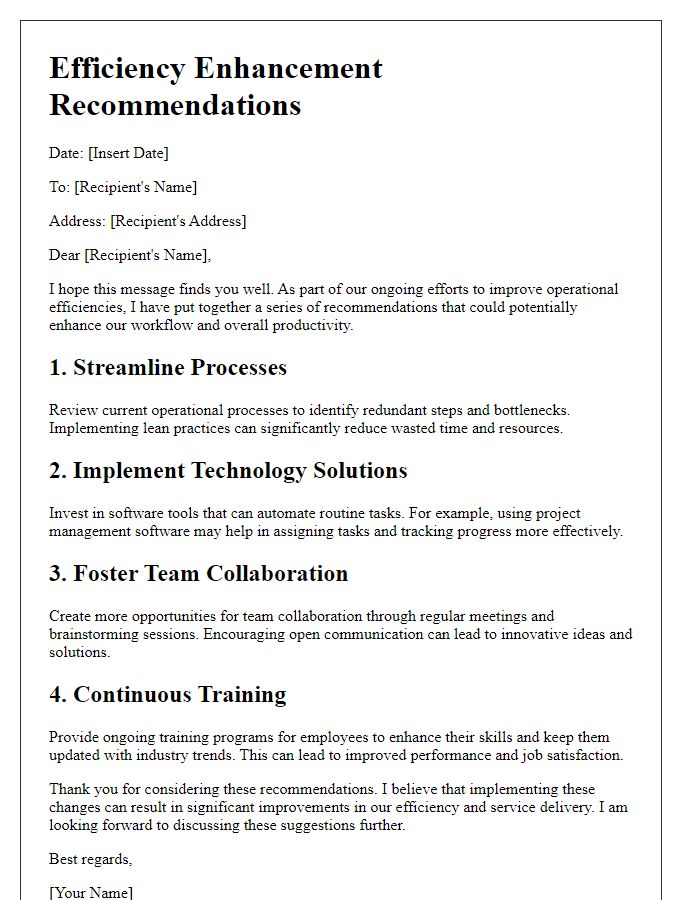
Operational efficiency reports highlight critical insights and strategies for enhancing productivity within organizations. These reports typically outline areas for improvement, such as streamlining workflows in manufacturing facilities or increasing employee engagement in corporate settings. Recommendations often involve implementing new technologies, like project management software or automation systems, to reduce redundancy and optimize resource use. Action plans detail specific steps to be taken, including timelines and responsible parties, ensuring accountability in the improvement processes. For effective communication, these reports should up-to-date metrics and key performance indicators (KPIs), enabling stakeholders to track progress over time.
Conclusion and Next Steps
The operational efficiency report from Q3 2023 highlights key performance indicators (KPIs) within the production facility located in Springfield, including machine uptime averaging 87%, which is below the target of 95%. Workflow analysis indicated bottlenecks in the assembly line, particularly at station four, where idle time reached 30%. Employee training initiatives demonstrated improvements in output quality, reducing defect rates to 2.5%. To enhance productivity, implementing additional training sessions and upgrading equipment at critical stations is essential. Future steps involve conducting a follow-up assessment in December 2023 and establishing a cross-departmental task force to monitor progress and ensure sustainable improvements.



Comments