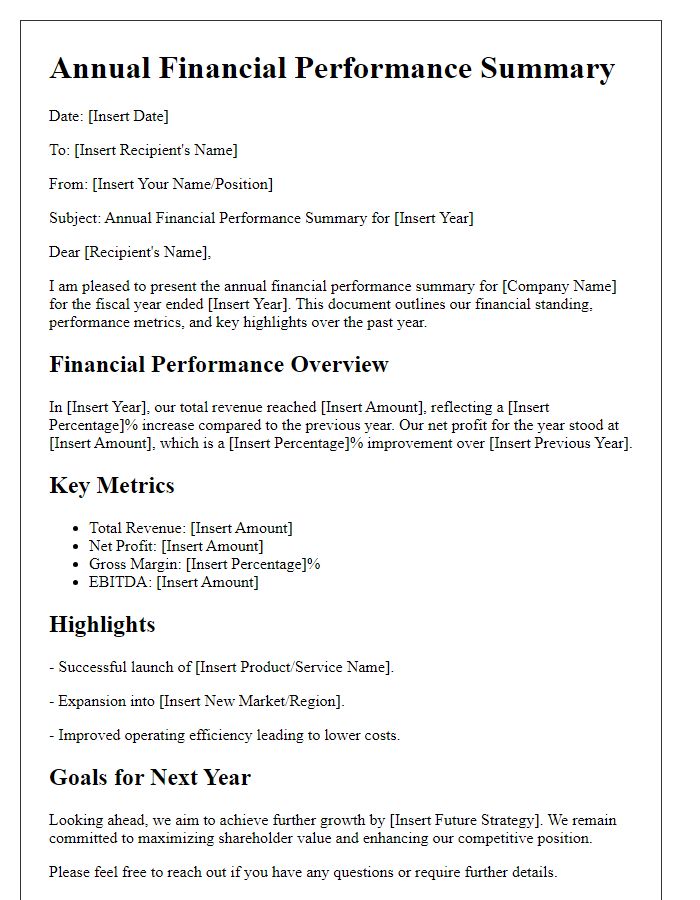
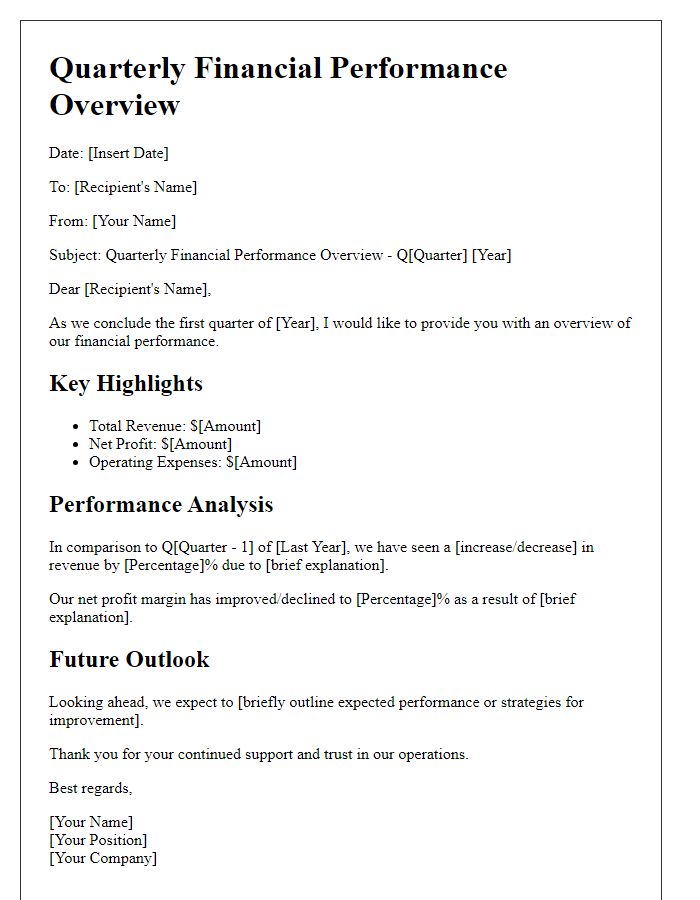
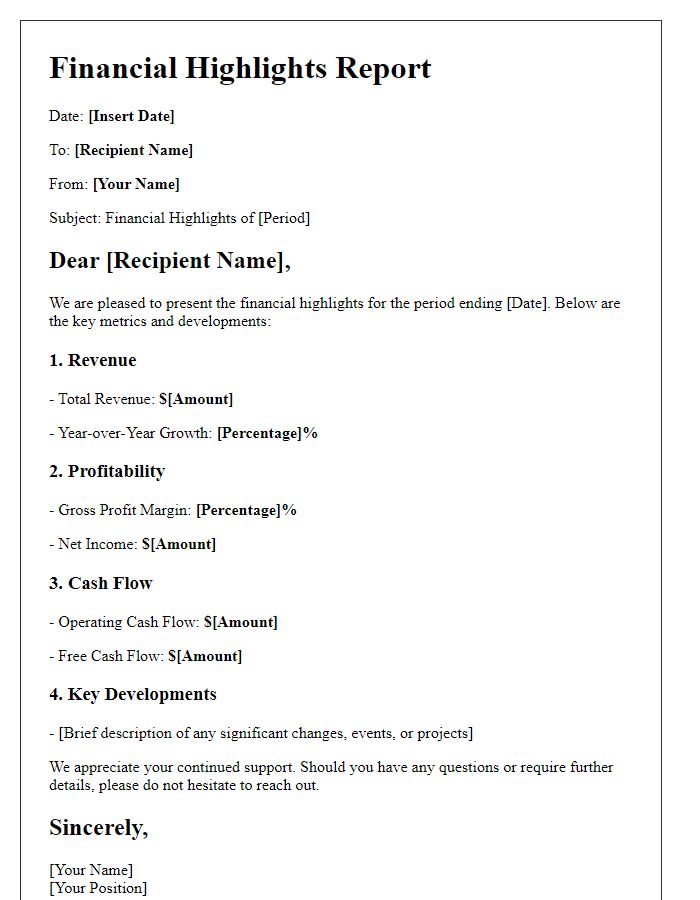
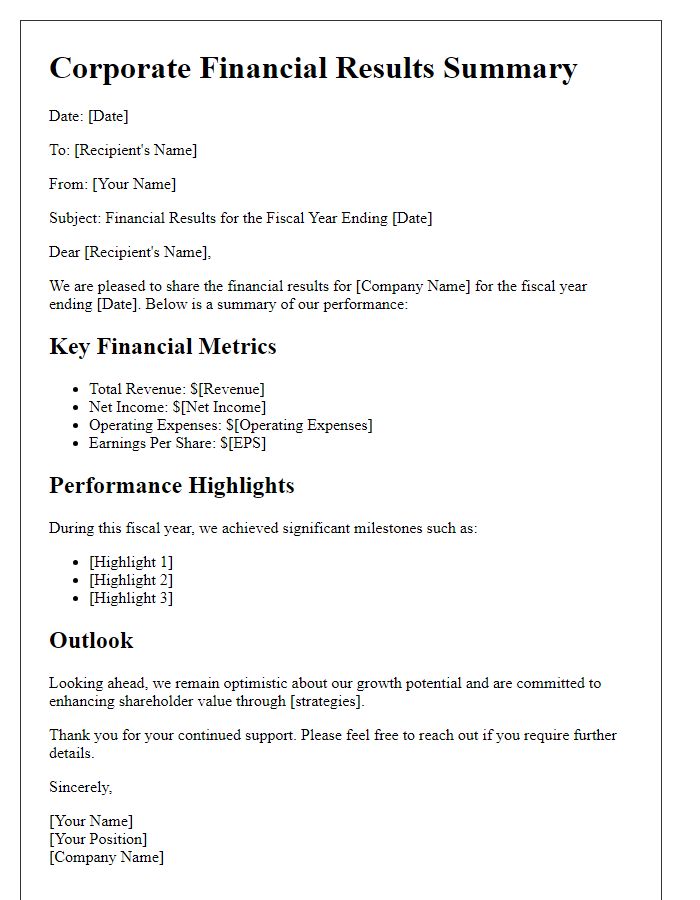
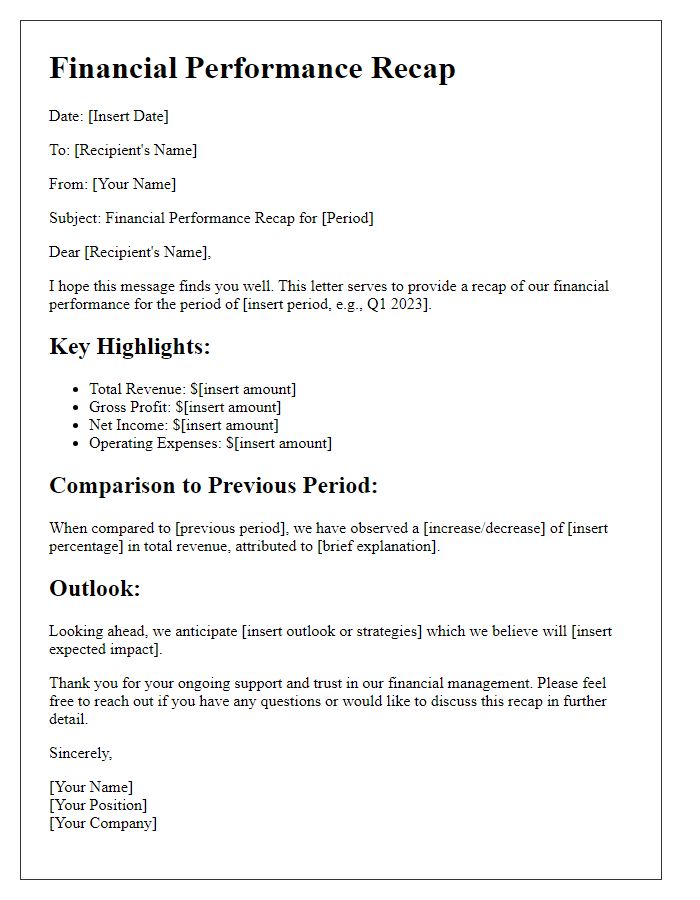
Are you looking to convey your financial performance clearly and effectively? Crafting a well-structured letter can make all the difference in communicating key insights and results. In this article, we'll explore an easy-to-follow template that ensures you cover all important details while keeping your audience engaged. So, let's dive in and uncover the essential elements of a compelling financial performance summary!

Financial Overview
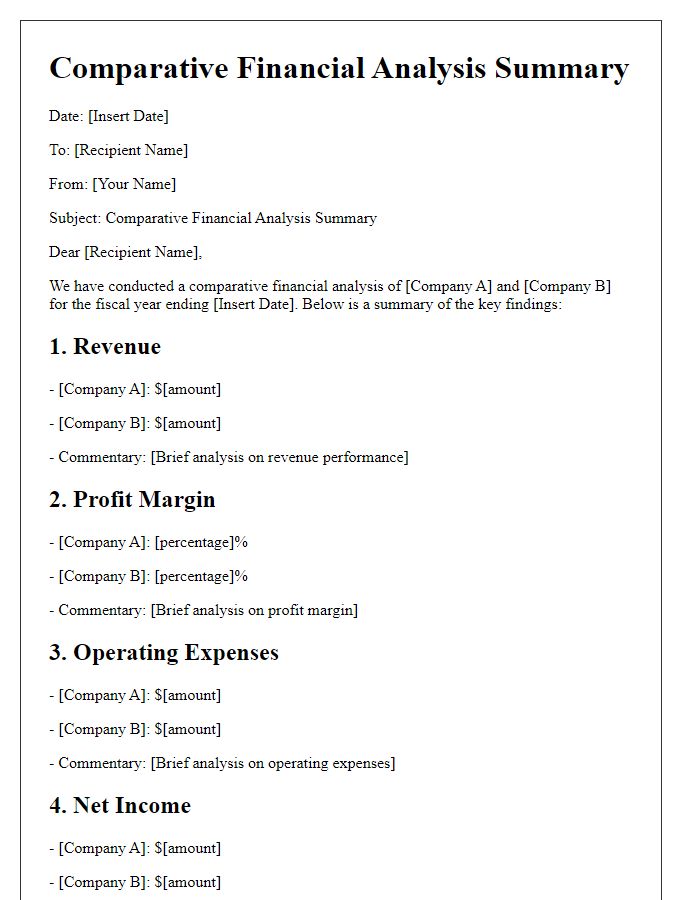
The financial overview provides a comprehensive analysis of a company's economic activities over a specific reporting period. Key financial metrics, such as revenue (total sales received), gross profit margin (the difference between revenue and cost of goods sold expressed as a percentage), operating expenses (ongoing costs for running the business), and net income (profit after all expenses and taxes), serve to illustrate the overall fiscal health. The report may highlight significant events, such as mergers or acquisitions, which impact financial stability, alongside trends in cash flow--indicating how well the company manages its incoming and outgoing liquid assets. Additionally, comparisons with previous periods reveal growth patterns and areas requiring improvement. These insights guide stakeholders in strategic decision-making and investment assessments.
Key Performance Indicators (KPIs)
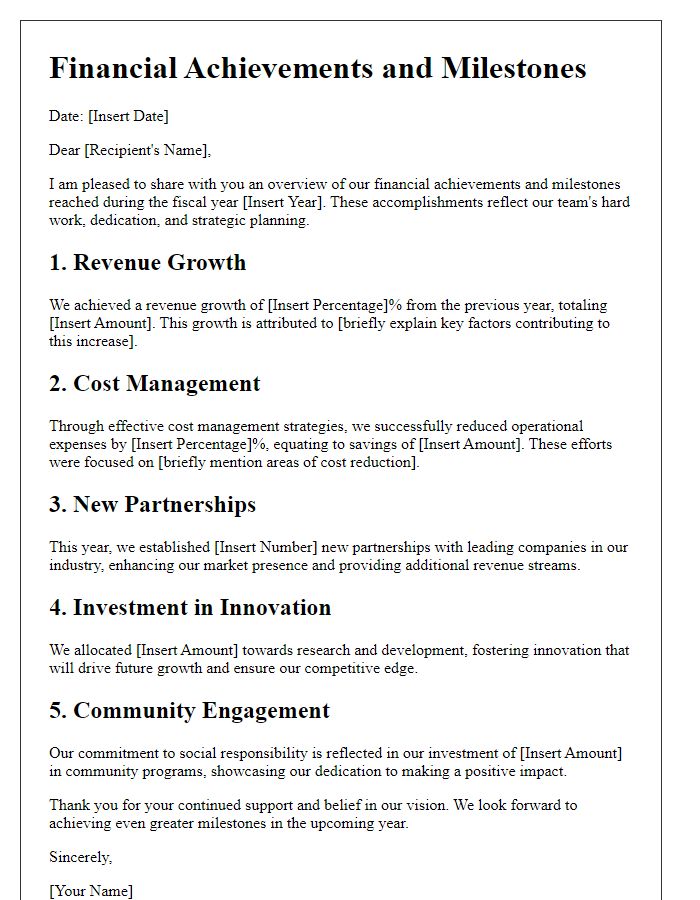
In examining the financial performance summary of XYZ Corporation for the fiscal year 2023, several Key Performance Indicators (KPIs) reveal significant insights into the company's operations. The revenue increased to $10 million, reflecting a 15% growth compared to 2022, driven primarily by a surge in product sales and expansion into new markets such as Eastern Europe. The gross profit margin stands at 40%, indicating efficient cost management in production processes. Operating expenses rose to $3 million, yet the operating income improved to $1.5 million, showcasing effective expense control amid rising inflation rates. The net profit margin achieved 12%, with net income totaling $1.2 million, highlighting profitability enhancements despite economic challenges. Additionally, return on equity (ROE) reached 18%, underscoring the effective utilization of shareholders' funds to generate earnings. Overall, these KPIs reflect the company's resilience and growth trajectory in a competitive environment.
Revenue and Profit Margins
The financial performance summary highlights the significant growth in revenue for the fiscal year ending December 2023, reporting a total revenue of $2.5 million, which marks a 15% increase compared to the previous year, driven by a 20% rise in sales of premium products. Profit margins also improved significantly, reaching 30%, up from 25% in 2022, attributable to improved operational efficiencies and cost management strategies. Key factors enhancing profitability include a reduction in production costs by 10% and increased pricing strategies on popular items in the portfolio. The geographical markets demonstrating the strongest performance include North America and Europe, which contributed 60% of total revenues due to a strategic marketing campaign launched in Q3. The overall financial health signals promising growth potential for future investments and market expansion initiatives.
Expense Analysis
The expense analysis for the third quarter of 2023 reveals significant insights into spending patterns. Total expenses reached $2 million, reflecting a 15% increase compared to the second quarter. Categories such as operational costs ($850,000), marketing expenses ($300,000), and salaries ($750,000) contributed substantially to this rise. Noteworthy is the marketing budget, which saw a 25% increase due to a new campaign launch in July aimed at expanding market reach in the Southeast region. Additionally, travel expenses surged to $150,000, attributed to increased business trips following the lifting of pandemic restrictions. Overall, this analysis underscores the need for a strategic approach in managing expenditures moving forward, focusing on sustainable growth while maintaining operational efficiency.
Future Outlook and Strategy
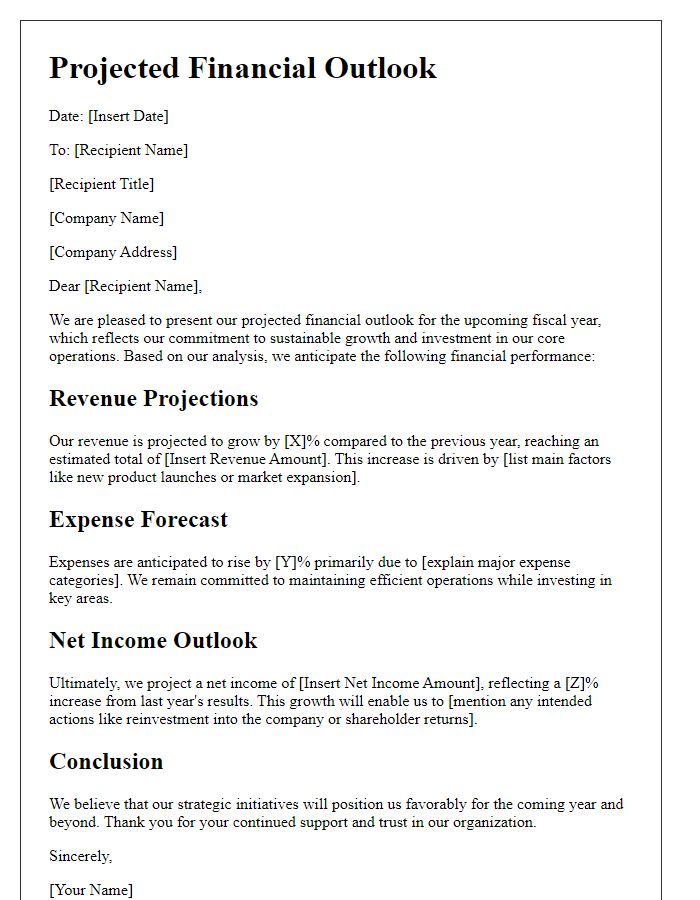
Future financial performance projections indicate steady growth driven by strategic investments in technology and market expansion. Current market trends suggest a potential increase in revenue by 15% annually, particularly in sectors such as renewable energy, which is projected to reach $1 trillion globally by 2030. Enhancements in operational efficiency through automation and data analytics are expected to reduce costs by approximately 10%. The focus on sustainable practices may result in lower regulatory risks and improved brand reputation. Additionally, entering emerging markets in Southeast Asia, specifically Vietnam and Indonesia, presents new opportunities for customer acquisition, considering their combined population of over 300 million. Overall, a robust strategy emphasizing innovation and geographic diversification aims to bolster long-term profitability.




Comments